


In case you haven’t yet heard of a digital photography project called Phototrails, haven’t you ever wondered what happens to the millions and billions of photos that are uploaded day after day? What really happens to the trillion of photographs shot each year? Right, they’re not only floating as endless combinations of ones and zeros among the clouds. Seriously, here are some folks making good use of all these photos that also give information on social, cultural and political insights about people’s activity around the world. And that’s where Phototrails steps in: by gaining insights from this type of massive collective visual production.
In Phototrails’ own words:
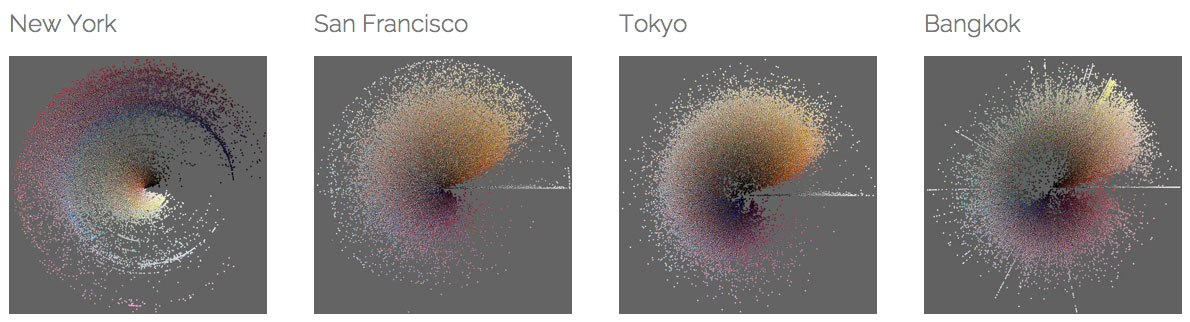
Phototrails is a research project that uses experimental media visualization techniques for exploring visual patterns, dynamics and structures of planetary-scale user-generated shared photos. Using a sample of 2.3 million Instagram photos from 13 cities around the world, we show how temporal changes in number of shared photos, their locations, and visual characteristics can uncover social, cultural and political insights about people’s activity around the world.
Phototrails explores the world’s photos on multiple spatial and temporal levels, moving between the planetary-scale cultural and social patterns to the micro level of particular places and times.
As opposed to privelleging “close reading” (analysis of singular texts) or “distant reading” (analysis of large scale patterns), they use interactive visualizations to perform a multi-scale reading — moving between the global-scale cultural and social patterns and the close-ups revealing patterns of individual users.
The project is part of the emerging research field of cultural analytics which uses computational methods for the analysis of massive cultural datasets and flows.
Seriously, the whole project is a kind of frustrating, isn’t it. Everyone who uploads images into the cloud is regarded as a minuscule part in a much larger picture that may or may not offer patterns. Meaning: changing social, cultural or political patterns can be mapped in real time. At least that’s the goal. To reach this goal also social media, blogs, etc. have to be included. Photographs play one big part in this Big Brother vision.
But let’s go back to Phototrails. You can argue about the aesthetic value of Instagram uploads. That’s not the point. The point is that the photos visualize the world’s rhythm of life. Take the free software ImagePlot of the same computer scientist Lev Manovich who together with art historian Nadav Hochman produced infographics each consisting of hundreds of thousands of Instagram images.
Each picture is at least 10.000 or 20.000 pixels wide, some are even wider, and when you zoom in you might even recognize single captures. Well it’s easy to collect the data. Developers can select regional Instagram streams — as done by This is now!, a website offering Instagram streams from 12 major cities in real time.
Once you’re able to read the infographics, they tell whether people snap more pictures in daylight or at night. Whether they snap more nature shots, like to photograph food or take more pictures on a given weekday.
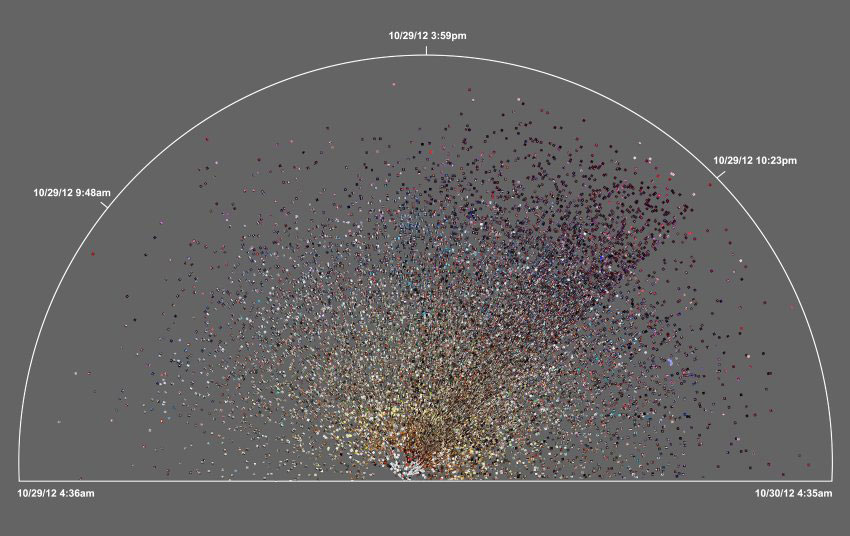
Or take this sample graphic showing Instagram photos uploaded from Brooklyn between November 29 and 30, 2012. Right, the time when Hurricane Sandy hit the coast. Timeline is from left to right. The more photos uploaded = the denser the semicircle in this area. Late on the 29th a clear parting line can be seen. That’s when the power failed in Brooklyn. Et voilà Phototrails crisis mapping:
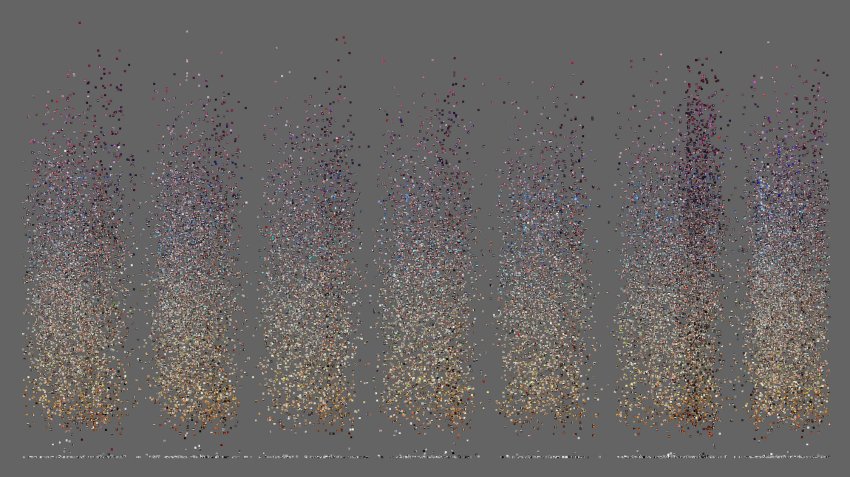
Or in this graphic from Tel Aviv, showing Instagram photos uploaded during a week in April 2012, you see a sudden spike on the sixth day at night. That’s when people celebrated independence day with fireworks:
These graphics show much more than meets the eye. They’re a kaleidoscope of human behavior. Brave new digital times! I wonder when we get the first personal analyses based on one’s photo stream…